
First, let me explain what an error I want to discuss. It usually displays itself during the job execution. It could happen at the beginning or at the end. There is generally no time correlation to the issue. All of a sudden, your job in the GitLab logs tab shows this:
ERROR: Job failed: command terminated with exit code 137Our runners are running exclusively only on Kubernetes. Most of the cases that is an OOM kill. Kubernetes noticed a pod consuming too much memory, exceeding the given limit in the request, and killed the pod.
But that’s not generally the case. See, this error is a result of a kill command. More specifically, kill -n 9 PID. Check out a nice explanation at Baeldung. That means something decided our pod executing the GitLab job is doing something it shouldn’t and deserves to be killed. What is that wrong behaviour? That’s up to you to find. It could include scaling, OOM kill, volume space consumption, … your guess is good as mine.
For normal pods running under deployment, statefulset, … you can check termination reasons. But you are left in the dark for pods created by GitLab Runner. The pod disappears once deleted, and that’s it. Yes, you can have logs and events pushed to your monitoring, but for us, we had no such luxury.
An “ERROR: Error cleaning up pod” detour
There is one very similar error to the one I am trying to describe. It happens at the end of the job runtime during the cleanup phase. The output is usually like this:
ERROR: Error cleaning up pod: pods POD NAME not found

ERROR: Job failed: command terminated with exit code 137
We found out it is easily mitigated by setting QoS guaranteed per each pod executing the job. I don’t see any reason why you would set another QoS class. Saving a few schmeckles for opportunistic scheduling of pods to underutilised nodes? Remember that every pod with no QoS class-guaranteed will get killed for the sake of QoS class-guaranteed pods. That can create a small disruption in the pipeline which is very hard to debug.
Now, let’s jump back to the main story.
Ok, so why does this happen?
In our case, all pods are scheduled on the autoscaled node groups in the EKS cluster. During the day, the node count rises and gets lower. And when the number of pods started to fall, during that time, our mysterious error started to appear.
Don’t get me wrong, the error count is less than 1%. It wasn’t like all of the jobs started to fail. Check the following dashboard from Datadog:
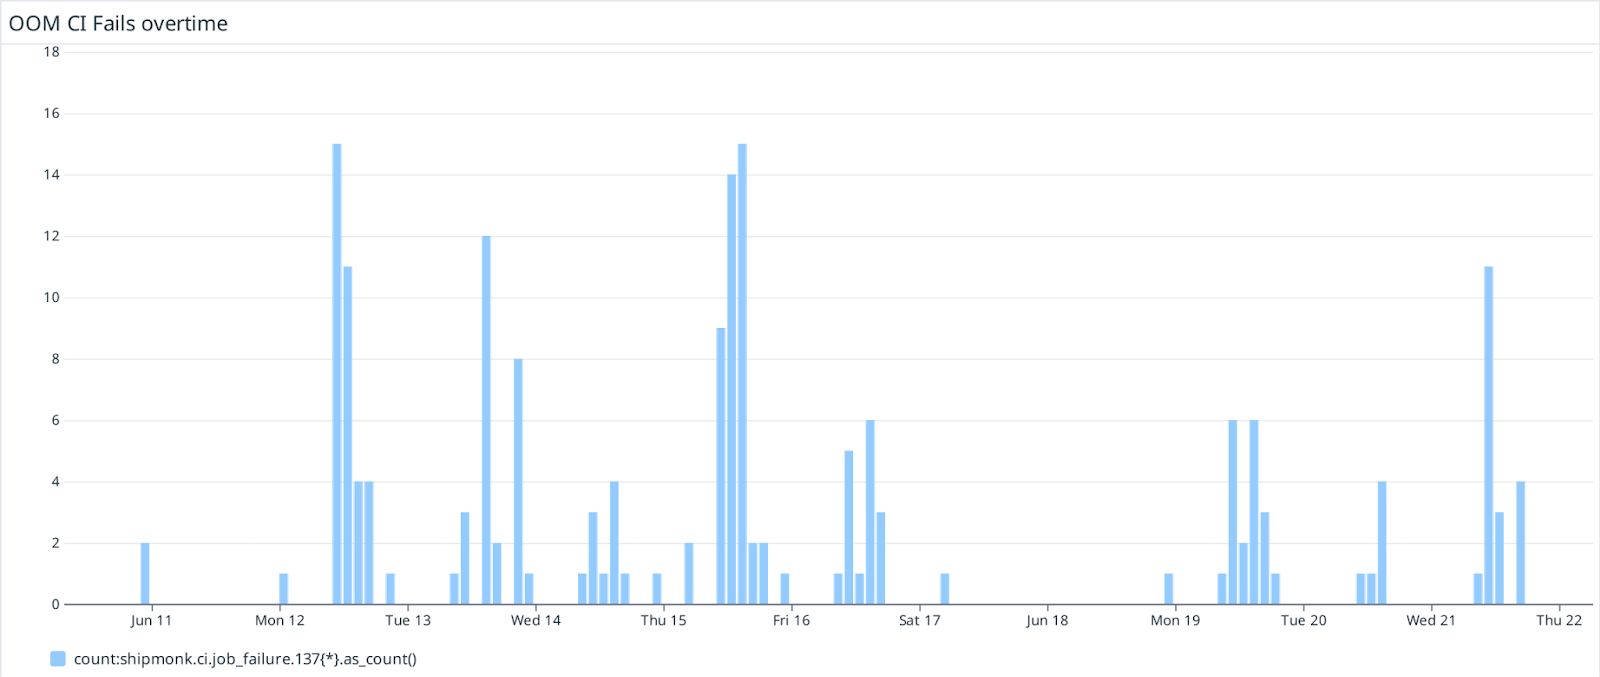
It displays the count of jobs which ended with exit code 137. That ain’t much, about 15 kills an hour at top. The problem is that this is happening at random. One job could be a test in a merge request, second a deployment into production. That’s why we are aiming at 0% of these jobs.
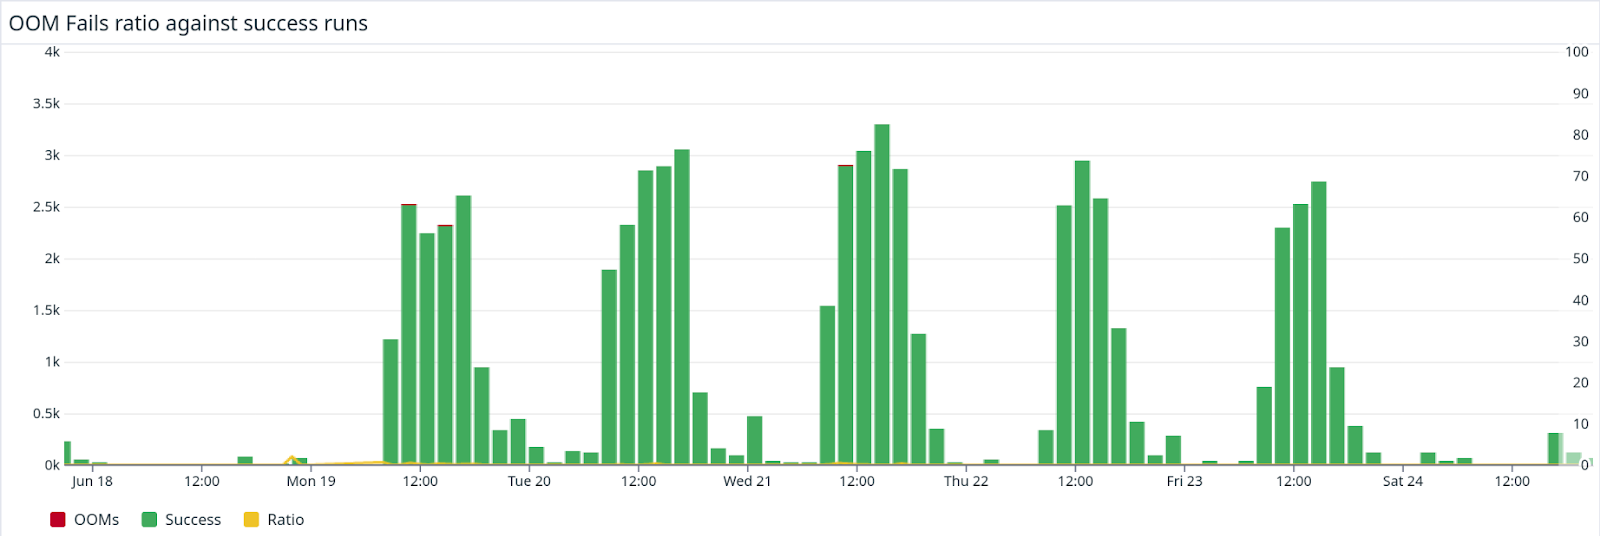
As I was describing, overall, we are in the green. Just to see the proportions of how many jobs we execute, check the ratio of failed jobs with a comparison to all the jobs executed during the day:

It’s not even visible on the exported graph.
After plenty of tests and discussions, we decided the issue correlated to downscaling of the node pool. It makes sense. The jobs have no controller above them to reschedule them onto different nodes. It’s not a deployment or job, so we haven’t considered deploying Pod Distribution Budgets (PDB) in the first place. Out of curiosity, we felt it was worth deploying the PDB even for these pods.
How would you even do that?
PDB on the standalone pod
You can, most definitely, create PDB to cover almost anything labels can select. Our first try looked like this:
apiVersion: policy/v1
kind: PodDisruptionBudget
metadata:
 name: gitlab-runner-job-global
 namespace: ci
spec:
 minAvailable: 100%
 selector:
   matchLabels:
     app: gitlab-runner-global-job
That worked only partially because of this error by the control plane:
Pods selected by this PodDisruptionBudget (selector: &LabelSelector{MatchLabels:map[string]string{app: gitlab-runner-global-job,},MatchExpressions:[]LabelSelectorRequirement{},}) were found to be unmanaged. As a result, the status of the PDB cannot be calculated correctly, which may result in undefined behavior. To account for these pods please set ".spec.minAvailable" field of the PDB to an integer value.Ok, that makes sense. Let’s give it a number. But how much? Or even better, will any high number do the trick? Let’s try the following:
apiVersion: policy/v1
kind: PodDisruptionBudget
metadata:
 name: gitlab-runner-job-global
 namespace: ci
spec:
 minAvailable: 100000
 selector:
   matchLabels:
     app: gitlab-runner-global-job
Don’t forget to set the labels for the pod executing the jobs. That could be done by configuration option for GitLab runner:
 [runners.kubernetes.pod_labels]
   app = "gitlab-runner-global-job"
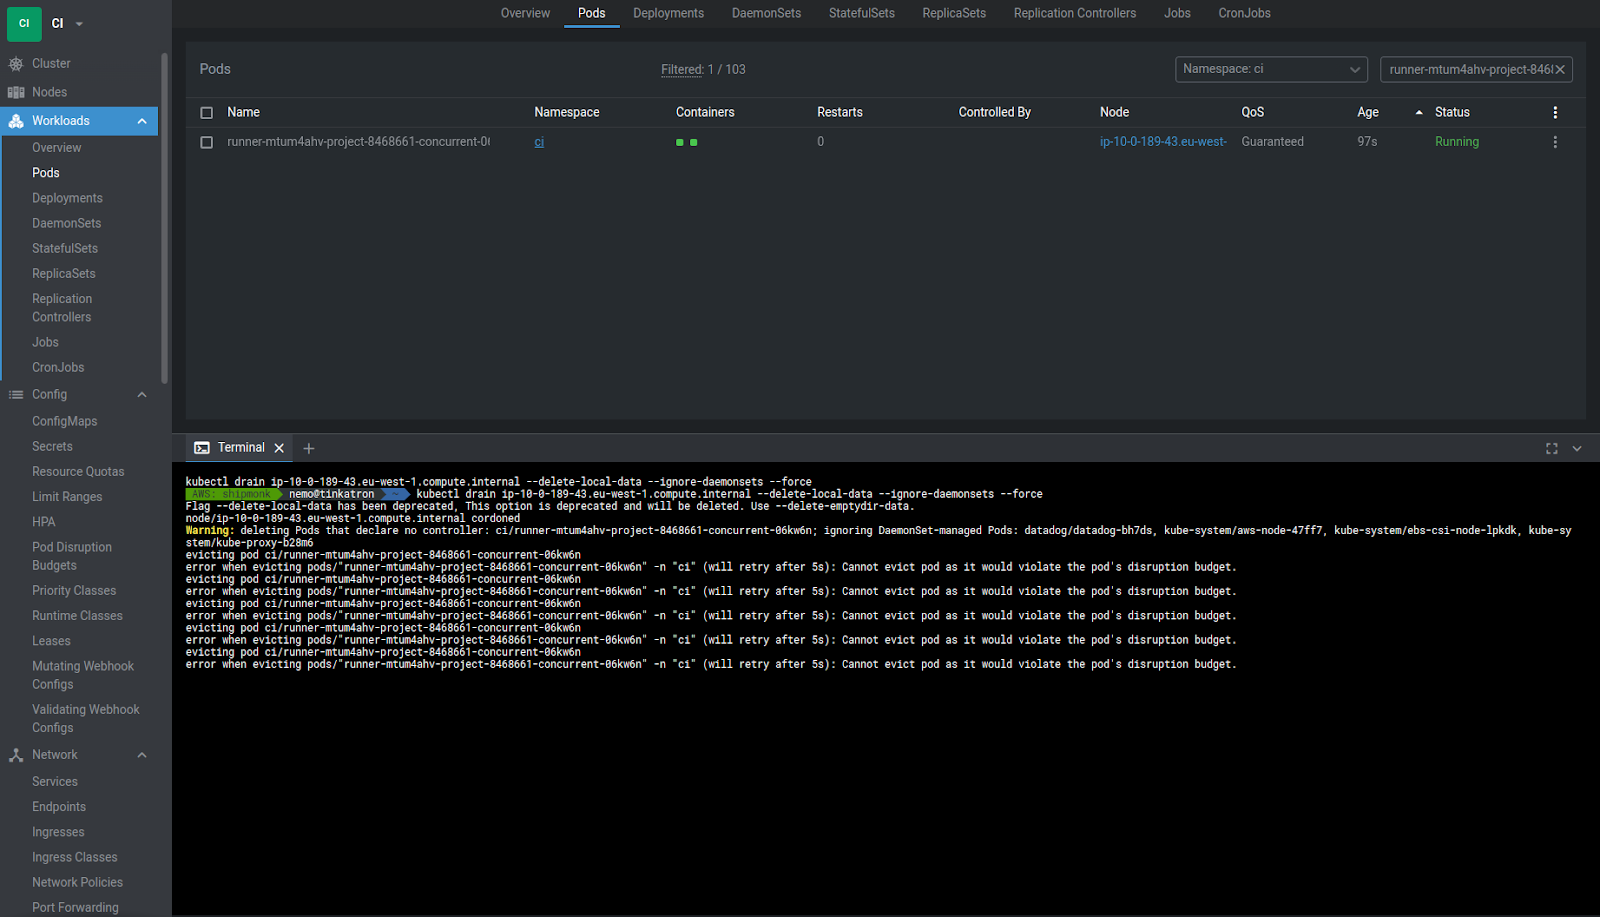
There is hardly any part of the day where we have more than 100000 jobs running. Therefore the number works all the time. I also checked what happens once you start to drain the node in the cluster. PDB won’t allow a pod with a running job to be evicted and waits until the job is done, which is desirable behaviour:
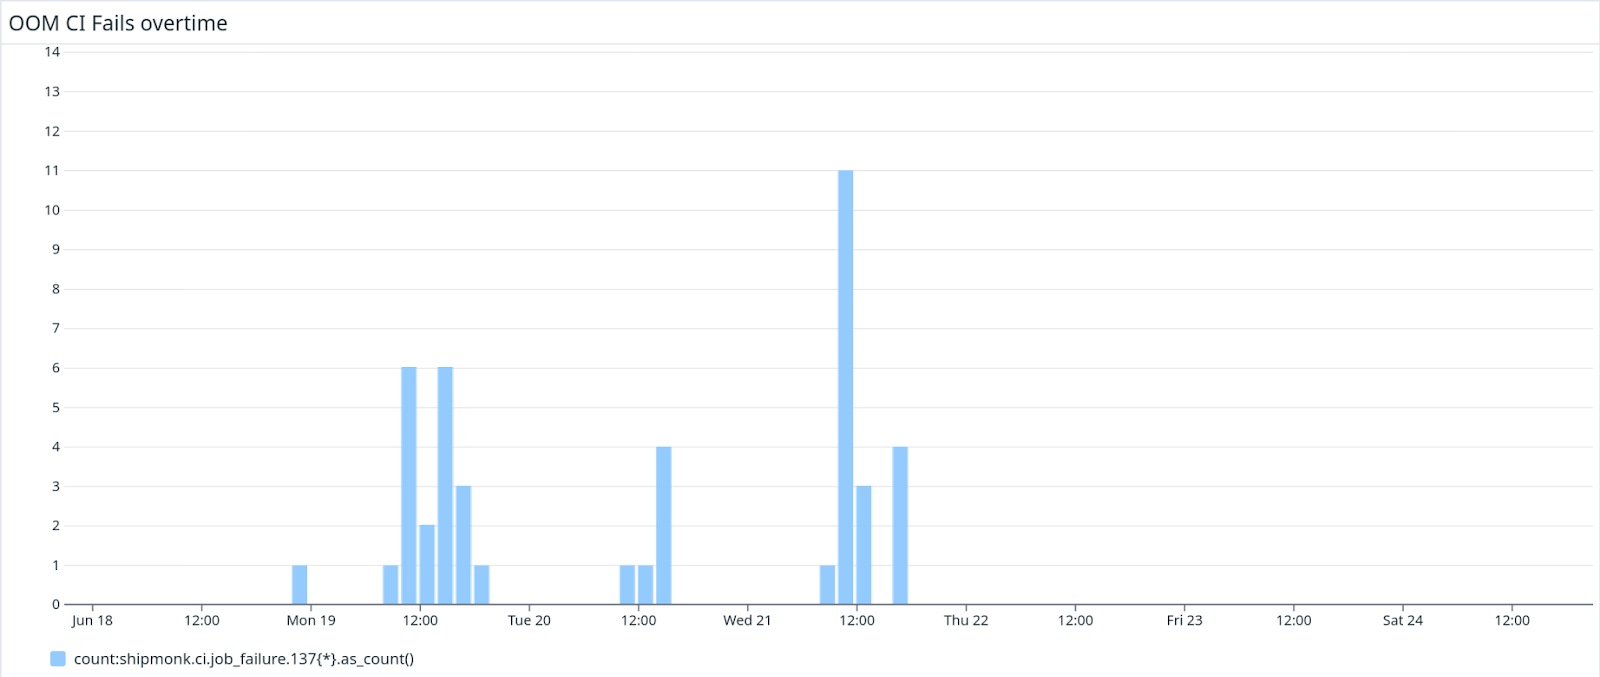
I was misled by red herrings multiple times. But this time, this time I felt we finally got it. After a day, I checked the graphs in the Datadog dashboard and knew we had a reason to finally be happy. The last mysterious 137 kill happened a day ago:
Sum up
We wouldn’t host our Kubernetes runners if the public ones were stable enough for our builds. As you noticed, there are thousands of runs every day. Ultimately, we felt running our jobs under our administration was still cheaper. Needless to say, resolving this issue took us months. How cheap it sounds now?
It hasn’t occurred earlier that I can just set PDB on any ad-hoc pods. Thanks to a rubber duck colleague, who asked if we could do something about it, I iterated to deploy a PDB. And it worked. Sometimes, you have the solution in front of you the whole time but dismiss it because it’s too simple, obvious or possibly unrelated.
Like the YouTubers peeps say, like and subscribe to read more about our escapades.
Thanks, Matěj Smíšek, for the Datadog dashboards and my whole team for review.